Interactive maps and dashboards built on my research data: night lights of Italian municipalities, the 2026 World Cup, fuel prices, the Emilia-Romagna flood.
Interactive maps and dashboards built on my research data: products, not papers, that show the tools I work with.
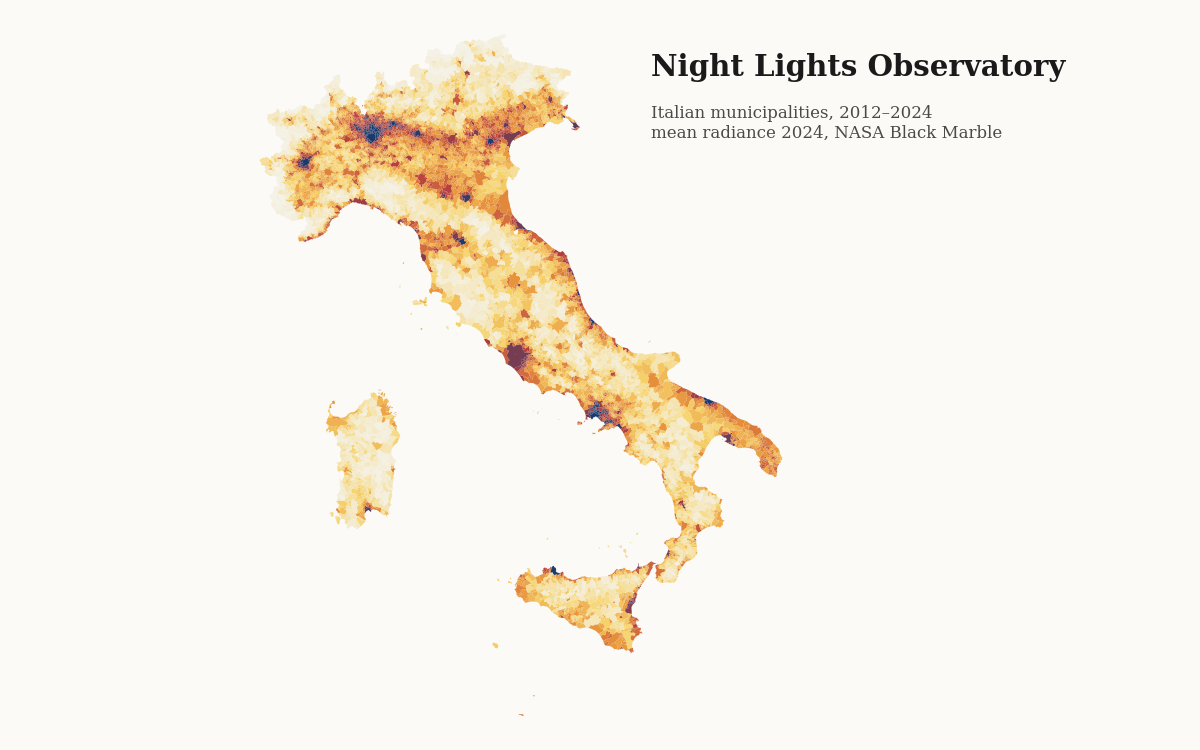
Interactive map of night-time light radiance for all 7,903 Italian municipalities from NASA Black Marble, with a year slider, municipal time series, growth and decline by inner-area (SNAI) class, and the key results of my ongoing work on whether night light measures inequality.
MapLibre GL · NASA Black Marble VNP46A4 · ISTAT · SNAI · Python
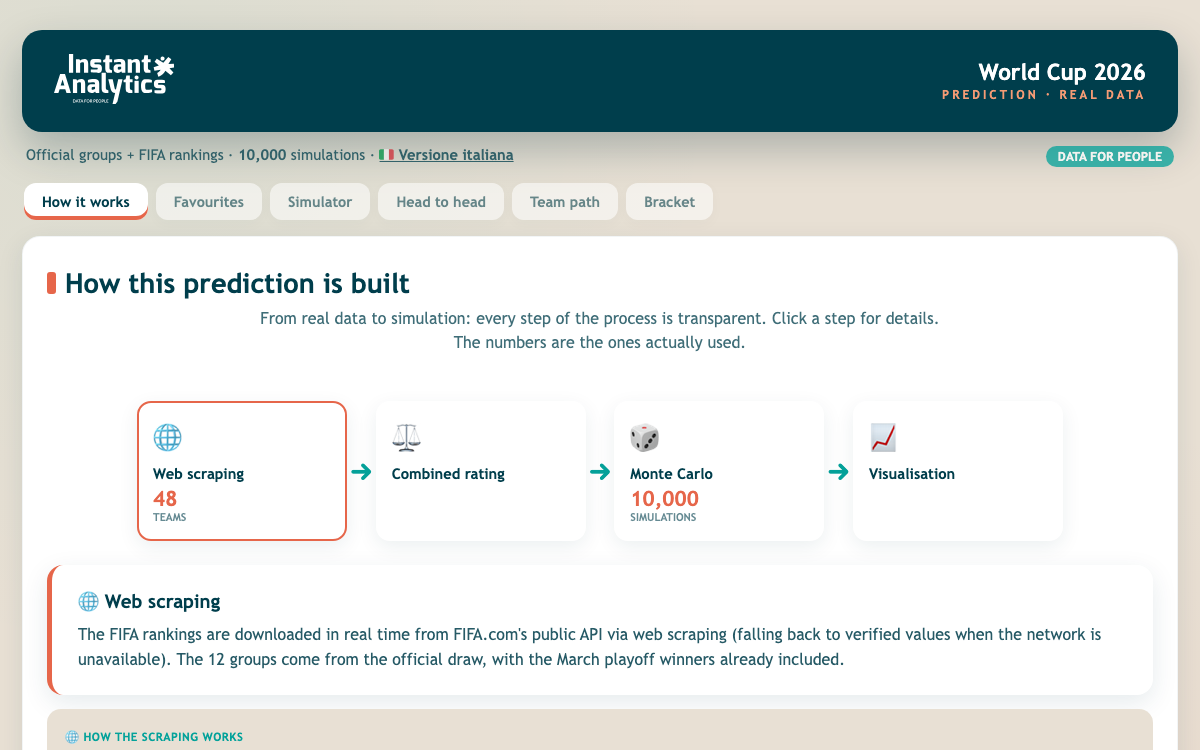
With Instant Analytics. Interactive dashboard combining the official draw and FIFA rankings with 10,000 Monte Carlo tournament simulations, favourites, head-to-head comparisons, team paths and a simulated bracket, all running in the browser (English and Italian).
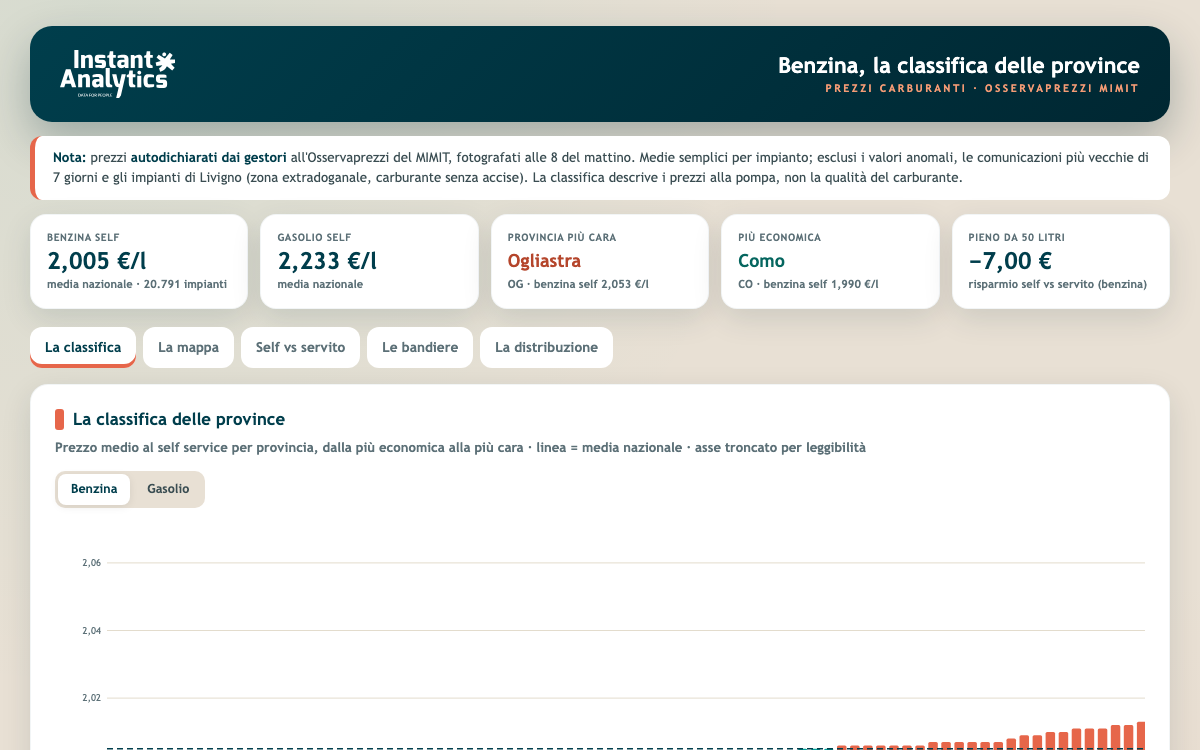
With Instant Analytics. A dashboard that rebuilds itself every morning from the Ministry’s Osservaprezzi data on more than 20,000 stations, with a ranking and map of all 110 provinces, the self-service vs full-service gap, brand comparison and the price distribution (in Italian).
HTML/JS · MIMIT Osservaprezzi open data · automated daily pipeline
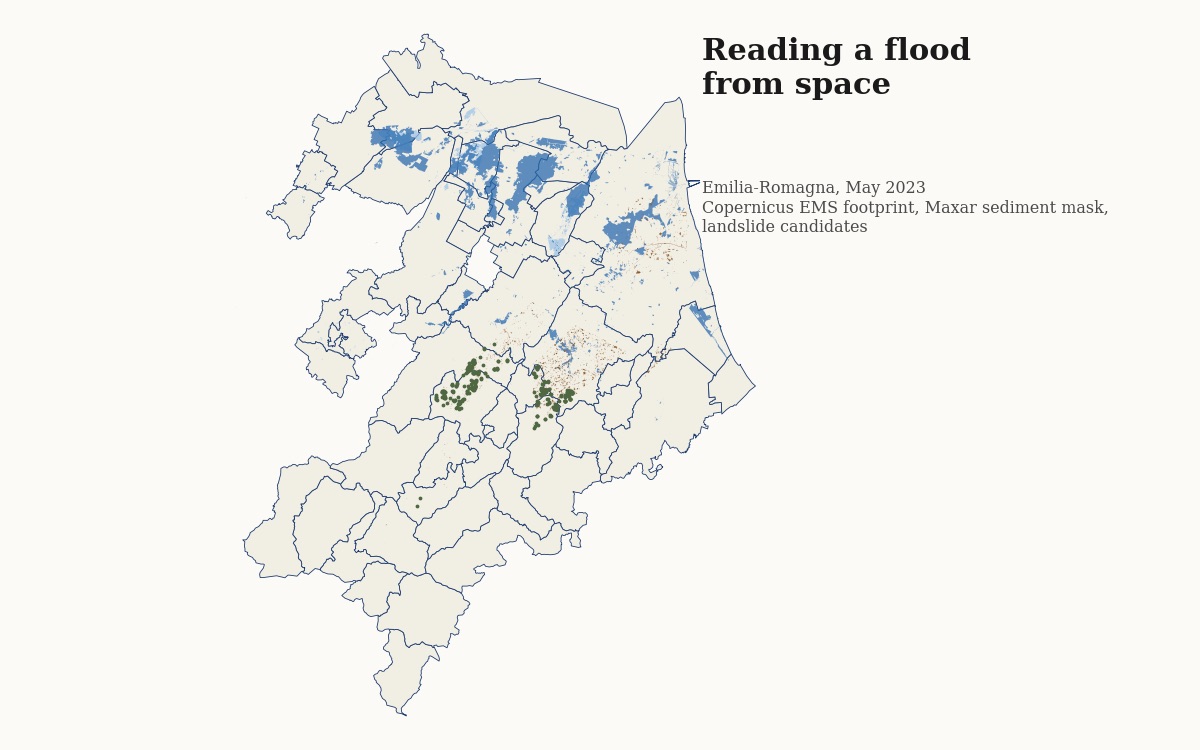
A story map from the satellite pixel to the economic ledger: Maxar before/after imagery, a calibrated sediment mask validated against the Copernicus EMS footprint, landslide candidates in the hills, exposure of buildings and services, the null result on annual income and population, and the transitory discount on house prices by OMI zone.
MapLibre GL · Maxar Open Data · Copernicus EMS · Overture Maps · OMI · Python/GDAL